How to Build a Swing Trading Strategy Step-by-Step (2026 Guide)
Most traders don't have a strategy. They have a collection of random indicators and a habit of buying breakouts because they saw someone post about it on Twitter. When it works, they call it a strategy. When it doesn't, they call it bad luck.
A real swing trading strategy is a rigid, rules-based system. It tells you exactly what to buy, when to buy it, how much to risk, and when to get out — before you ever place the trade. No discretion, no vibes, no "it looked strong." This guide walks through every component of a swing trading strategy you can actually test, trust, and trade with Indian equities.
What Makes a Trading Strategy "Rules-Based"?
A rules-based swing trading strategy has five parts, and if any one of them is missing, you don't have a strategy — you have a hunch:
- Universe — which stocks you're allowed to trade
- Entry trigger — the exact, measurable condition that puts you in a trade
- Position size — how much capital and risk each trade gets
- Exit rules — stop loss, target, and time-based exits
- Backtest validation — proof the rules made money historically, before you risk real capital
Skip any of these and you're gambling with extra steps. Let's build each one.
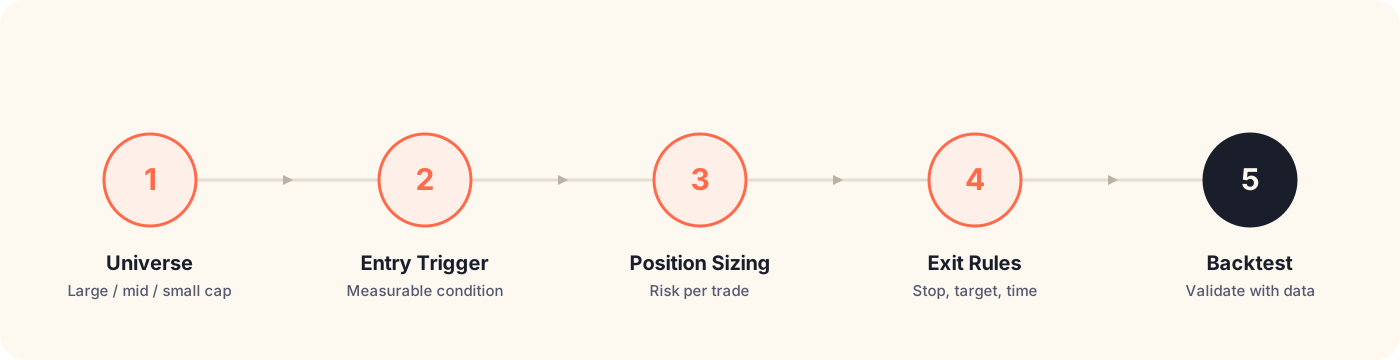
The five components every rules-based swing trading strategy needs.
Step 1: Define Your Trading Universe
You cannot scan 5,000+ listed Indian stocks manually every day. You need to restrict your focus to a specific universe of stocks that fits your risk profile and the way you trade.
- Large Caps (Nifty 50): Low volatility, highly liquid, slower moves. Good for mean-reversion and pullback strategies where you need tight, reliable price action.
- Mid Caps (Nifty Midcap 100): Higher volatility, prone to massive multi-week trends. Good for momentum and breakout strategies that need room to run.
- Small Caps: Highest volatility and the biggest trend potential, but liquidity and slippage become real problems — a strategy that backtests beautifully on paper can bleed money in live execution if the stock can't absorb your order size.
Pick one universe and stick to it while you're building and testing. A 20-day EMA crossover strategy that works on Nifty 50 stocks will behave completely differently on illiquid small caps — the same rules, wildly different results, purely because of the underlying liquidity profile. Mixing universes without accounting for this is one of the fastest ways to make a backtest lie to you.
Step 2: The Entry Trigger
What exact market condition forces you into a trade? This cannot be subjective. "When the stock looks strong" is not a trigger — it's an opinion, and opinions can't be coded, backtested, or repeated consistently.
A measurable entry trigger looks like this:
- Price closes above the 20-day Exponential Moving Average (EMA)
- Relative Volume (RVOL) is greater than 2.0
- The RSI is crossing above 30 from oversold territory
Keep it simple. Complex triggers stacking five different indicators usually just lead to overfitting — you end up with a rule set so specific it only worked on the handful of historical trades you designed it around, and it falls apart on new data.
Broadly, entry triggers fall into three families:
- Breakout entries — price closes above a prior resistance level or N-day high, usually paired with a volume filter
- Pullback entries — price retraces to a moving average or trendline within an existing uptrend, then resumes
- Mean-reversion entries — price moves to a statistical extreme (like an oversold RSI) and you bet on reversion to the average
Pick one family that matches your universe. Breakout strategies tend to suit trending mid-cap names; mean-reversion tends to suit range-bound large caps.
Step 3: Position Sizing and Risk Per Trade
This is the step most retail traders skip entirely, and it's the one that actually keeps you in the game long enough for your edge to play out.
Decide, before you ever place a trade, what percentage of your capital you're willing to lose if the trade goes wrong. A common approach:
- Risk no more than 1–2% of total capital per trade
- Use the Average True Range (ATR) to size your stop loss relative to the stock's normal volatility, instead of a fixed percentage that doesn't account for how much a stock actually moves day to day
- Size your position so that (entry price − stop loss price) × quantity equals your fixed risk amount
This single rule is what separates traders who survive a losing streak from traders who blow up their account on one bad week. A strategy with a 45% win rate and disciplined 1% risk per trade can be enormously profitable. A strategy with a 70% win rate and no risk control can still wipe you out.
Step 4: Exit Rules — Stop Loss, Target, and Time
Your exit rules need to be just as mechanical as your entry. Three components:
- Stop loss: Where you're proven wrong. Usually placed below a recent swing low or a multiple of ATR from entry.
- Profit target or trailing stop: Either a fixed reward-to-risk ratio (e.g., exit at 2x your risk), or a trailing stop that locks in gains as the trade moves in your favor.
- Time-based exit: A maximum holding period. Swing trades that haven't worked within, say, 10–15 trading days often aren't going to — capital sitting in a dead trade is capital that isn't working elsewhere.
Write these down as explicit, numeric rules. "I'll exit when it feels toppy" is not an exit rule.
Step 5: Backtest Before You Risk Real Money
Once your universe, entry, position sizing, and exit rules are written down, the strategy is testable — and until you've tested it against years of real historical data, you have no idea whether it actually has an edge or whether the last few trades you remember were just luck.
This is where backtesting comes in: applying your exact rule set to historical price data to see how it would have performed through different market regimes — trending years, choppy years, and crashes. A strategy that only makes money in a strong bull run isn't a strategy, it's a beta bet dressed up as skill.
Common Mistakes When Building a Swing Strategy
- Curve fitting: Tweaking rules until they perfectly explain a small set of past trades. This produces a strategy that's memorized history, not one that predicts the future.
- Too many indicators: Stacking RSI, MACD, Bollinger Bands, and three moving averages into one entry condition usually narrows your signal count so much that you can't draw any statistically meaningful conclusion from the backtest.
- Ignoring transaction costs and slippage: Brokerage, STT, and slippage on mid-cap and small-cap names can turn a theoretically profitable strategy into a losing one once real execution costs are included.
- No out-of-sample testing: If you build and test your rules on the same data, you're not testing anything — you're just confirming what you already saw. Hold back a portion of your data the strategy has never seen, and validate on that.
Frequently Asked Questions
What is the best indicator for swing trading? There isn't one universally "best" indicator — it depends on your entry family. Moving averages and RVOL work well for breakout strategies; RSI and Bollinger Bands work well for mean-reversion strategies. What matters more than the indicator itself is that the trigger is precise, measurable, and validated with a backtest.
How much capital do I need to start swing trading? There's no fixed minimum, but position sizing matters more than account size. If you're risking 1% per trade with a reasonable stop distance, even a modest account can trade most Nifty 50 and midcap names without the position size becoming impractical.
How many trades do I need before I trust a strategy's backtest? As a rough guideline, fewer than 30–50 trades in a backtest usually isn't enough to draw a statistically reliable conclusion — the sample is too small to separate a real edge from random variance.
Turn These Rules Into a Tested Strategy
Writing the rules down is step one. The only way to know if they actually make money is to run them against real historical data. Build this strategy in MilesBT's no-code backtester and see exactly how it would have performed on the Nifty 50 or Midcap 100 over the last several years — before you risk a single rupee live.
Validate this strategy yourself
Stop relying on rules of thumb. Test indicators and custom swing setups against 5+ years of verified Indian market data on MilesBT.
Open Backtest Builder