What is MACD? A Complete Guide to the Indicator (And When It Fails)
MACD shows up in almost every trading course, every YouTube tutorial, and half the charting apps on your phone by default. Most traders can tell you it involves two lines crossing over — very few can tell you what it's actually measuring, or why it fails so often in sideways markets. Here's the full picture: the formula, how to read it correctly, and the specific conditions under which it quietly stops working.
What is MACD?
MACD stands for Moving Average Convergence Divergence. It's a trend-following momentum indicator that shows the relationship between two exponential moving averages (EMAs) of a stock's price.
The calculation has three parts:
- MACD Line = 12-period EMA − 26-period EMA
- Signal Line = 9-period EMA of the MACD Line
- Histogram = MACD Line − Signal Line
Those default periods (12, 26, 9) are the standard settings almost every platform ships with, and the ones most traders never think to question.
In plain terms: when the shorter-term (12-period) EMA is moving away from the longer-term (26-period) EMA, momentum is building in that direction. When the two EMAs converge back toward each other, momentum is fading. The histogram is just a visual shortcut for the gap between the MACD line and its own signal line — it makes momentum shifts easier to spot at a glance than staring at two overlapping lines.
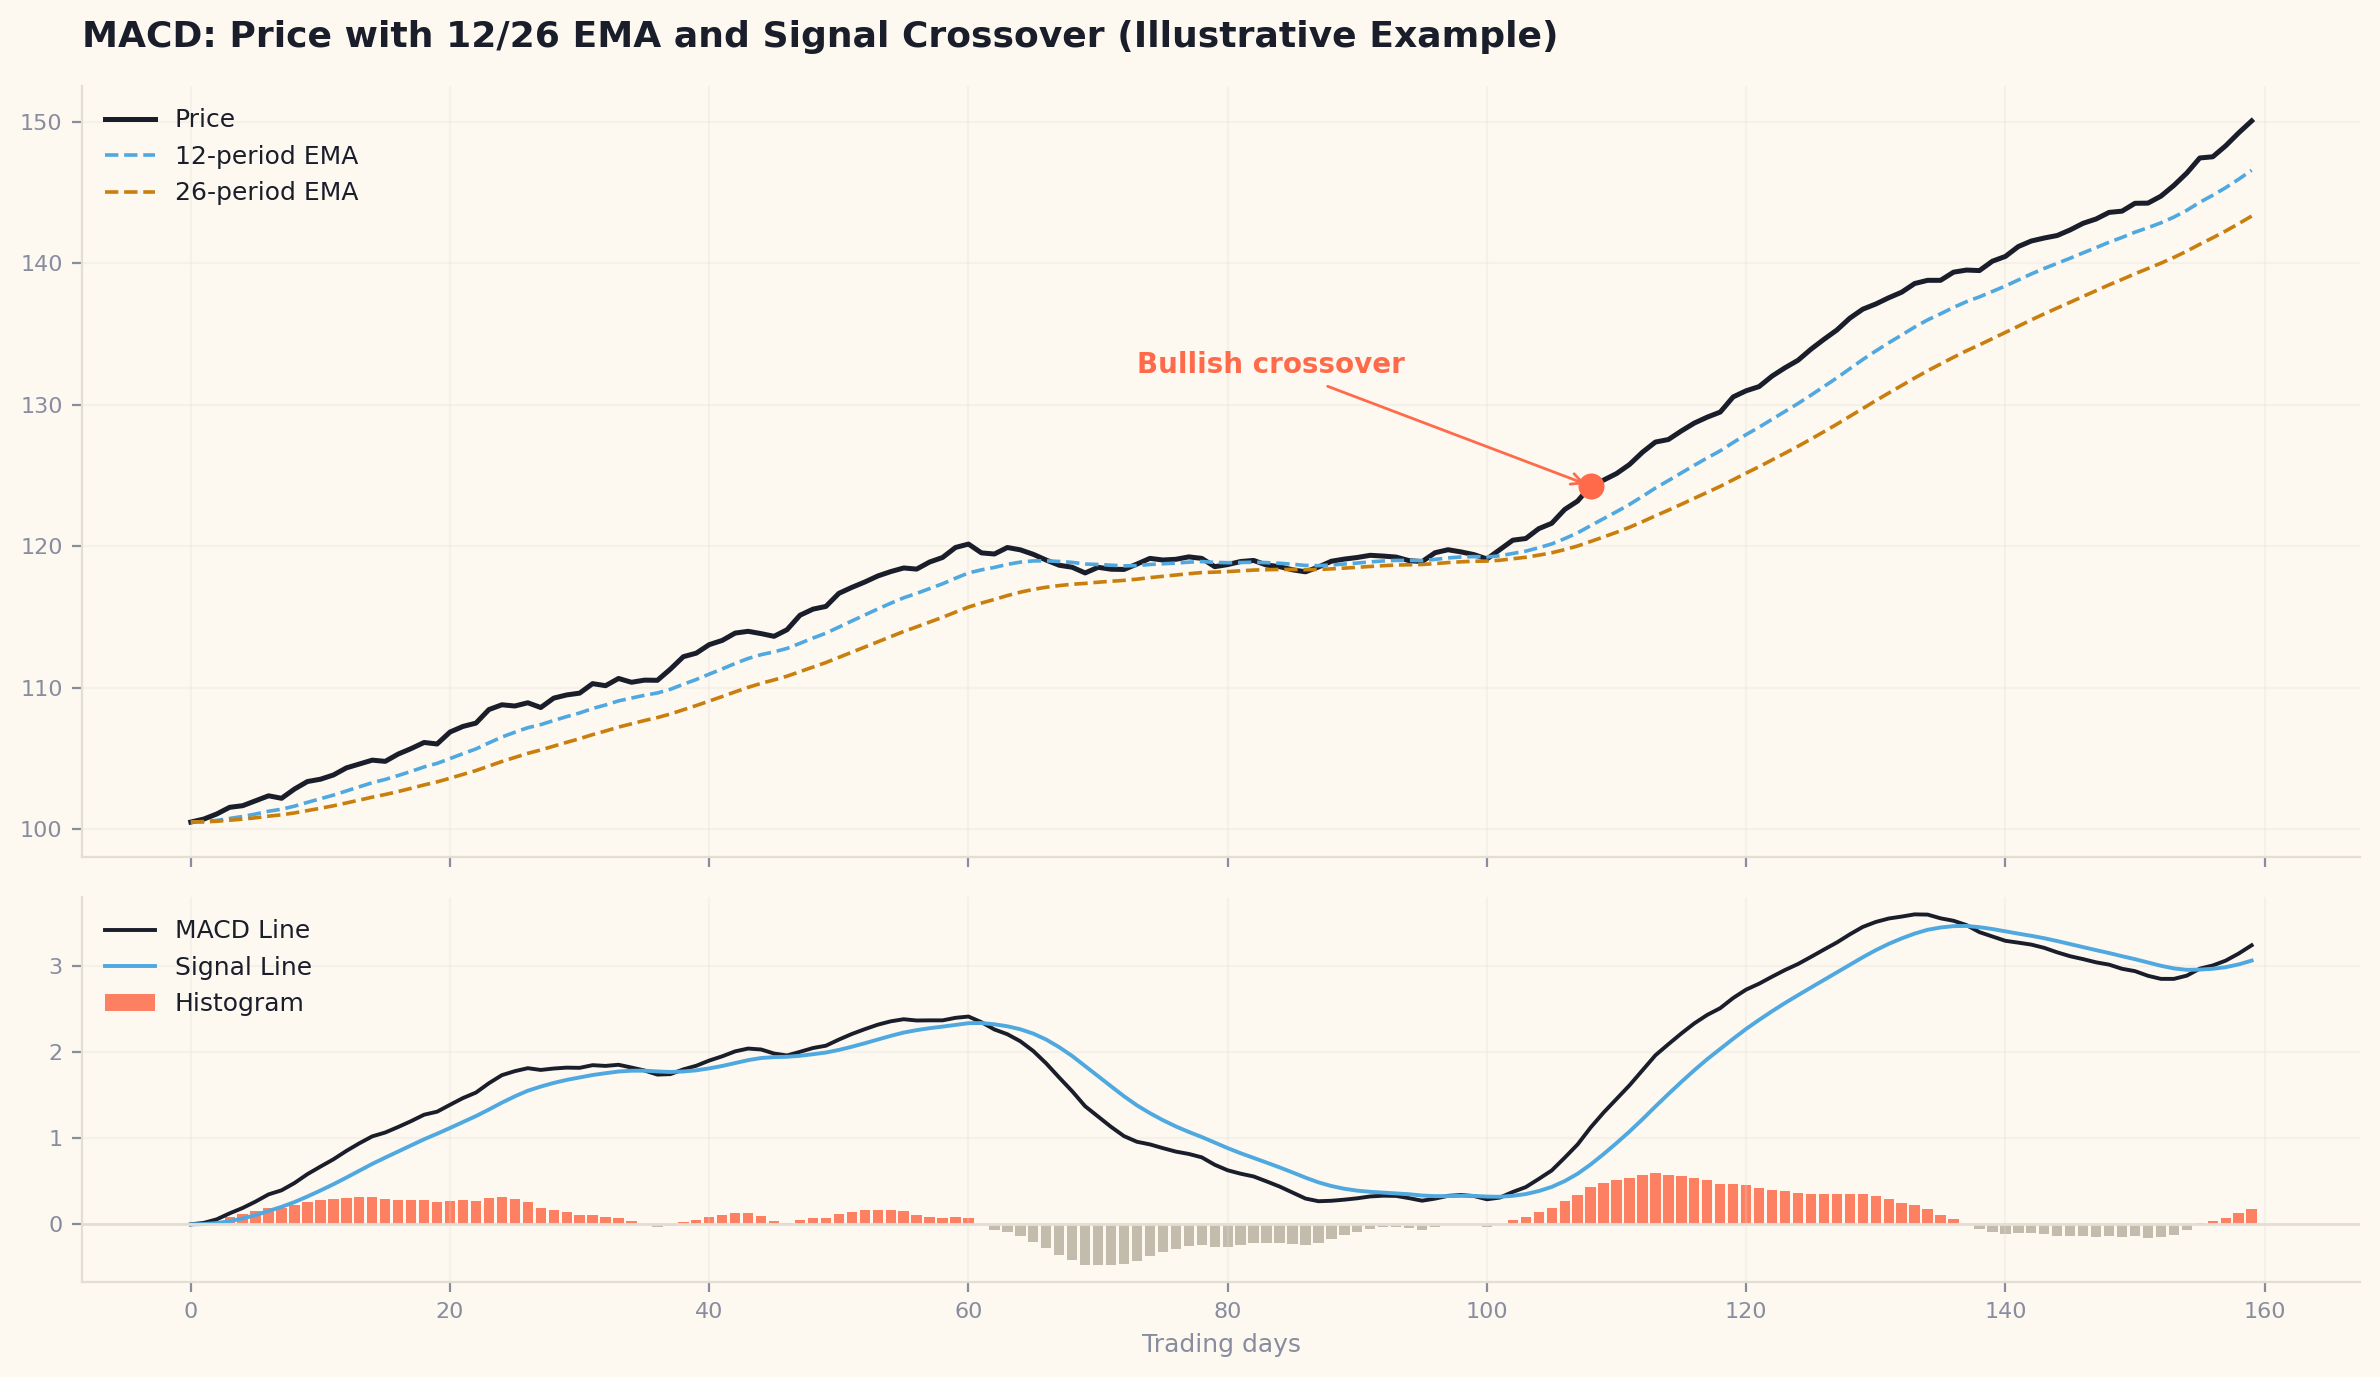
Illustrative example — price with 12/26 EMAs (top) and the resulting MACD line, signal line, and histogram (bottom). Not real market data.
How to Read MACD Signals
There are three distinct signals traders pull from MACD, and they are not interchangeable:
1. Signal Line Crossovers
When the MACD line crosses above the signal line, it's read as a bullish signal. When it crosses below, it's read as bearish. This is the most common — and most misused — MACD signal, because on its own it says nothing about the strength or context of the move.
2. Zero-Line Crossovers
When the MACD line crosses above zero, the 12-period EMA has moved above the 26-period EMA, suggesting a shift toward bullish momentum on a slightly longer timeframe than the signal-line crossover. This tends to be a slower, more reliable — but more lagging — signal.
3. Divergence
When price makes a new high but the MACD makes a lower high (or vice versa on the downside), that's divergence — a sign that the momentum behind the move is weakening even though price is still climbing. Divergence is the signal most experienced traders weight the heaviest, and the one most beginners skip entirely because it requires actually comparing chart structure, not just watching for a crossover.
Does MACD Actually Work?
This is the question that matters more than memorizing the formula, and the honest answer is: it depends entirely on market regime.
MACD is fundamentally a trend-following, lagging indicator — it's calculated from past price data, and it confirms a trend after it has already started, not before. In a strong trending market, that lag is a feature: it keeps you in a move instead of exiting on every small pullback. In a sideways, choppy market, that same lag becomes a liability — MACD generates crossover after crossover, and by the time each signal fires, price has often already reversed. This is what traders call "whipsaw," and it's the single biggest reason a MACD strategy that looks great on a trending stock chart can lose money consistently on a range-bound one.
The only way to know whether a MACD-based rule actually has an edge on a given universe of stocks — rather than just looking convincing on a handful of charts you remember — is to backtest it against years of historical data, across both trending and choppy periods.
Common MACD Mistakes
- Using it in isolation. MACD alone doesn't know whether the broader market is trending or ranging. Pairing it with a simple trend filter (like price relative to a 200-day moving average) dramatically changes how often its signals are reliable.
- Ignoring the histogram. Traders who watch only the crossover miss the earlier, more subtle warning the histogram gives as momentum starts to fade before the actual crossover happens.
- Never testing the default settings. The 12/26/9 combination was popularized decades ago on different instruments and timeframes than Nifty and Sensex equities trade on today. It's a reasonable starting point, not a rule carved in stone.
- Treating every crossover as equal. A signal-line crossover that happens near the zero line, in a market with no clear trend, carries far less information than one that happens after a strong zero-line crossover has already confirmed direction.
MACD vs. RSI
MACD and RSI are often taught side by side, but they measure different things: MACD measures the relationship between two moving averages (trend and momentum), while RSI measures the speed and magnitude of recent price changes (overbought/oversold conditions). They're not competing indicators so much as complementary ones — some traders use RSI to time entries within a trend that MACD has already confirmed.
Frequently Asked Questions
What are the best MACD settings for swing trading? The default 12/26/9 is the standard starting point, and there's no universally "better" setting — the right parameters depend on your holding period and the volatility of your chosen universe. The only reliable way to know is to backtest different parameter sets against your actual stock universe rather than adopting a number you saw in a video.
Is MACD a leading or lagging indicator? Lagging. It's derived entirely from past price data (via moving averages), which means it confirms momentum shifts after they've begun rather than predicting them in advance.
Can MACD be used alone as a complete trading strategy? It can generate entry and exit signals on its own, but most traders who rely on MACD alone experience significant whipsaw in sideways markets. Pairing it with a trend or volatility filter, and validating the combination with a backtest, tends to produce far more consistent results than the raw crossover rule by itself.
Test MACD Against Real Nifty Data
Reading about MACD is one thing — seeing exactly how a MACD crossover rule would have performed on the Nifty 50 or Midcap 100 over the last five years is another. Build and backtest a MACD-based strategy in MilesBT and find out whether it actually holds up, no coding required.
Validate this strategy yourself
Stop relying on rules of thumb. Test indicators and custom swing setups against 5+ years of verified Indian market data on MilesBT.
Open Backtest Builder