Risk-Reward Ratio and Expectancy: Why Win Rate Isn't Enough
"How often does your strategy win?" is the first question most traders ask, and the least useful one on its own. A strategy that wins 70% of the time can lose money. A strategy that wins only 35% of the time can be very profitable. The difference comes down to two ideas: the risk-reward ratio and expectancy. Once you understand them, you can judge any strategy on the numbers that actually matter.
What is the Risk-Reward Ratio?
The risk-reward ratio compares how much you stand to gain on a trade with how much you risk losing. Risk is the distance from entry to your stop loss. Reward is the distance from entry to your target.
If you buy at ₹100 with a stop at ₹95 and a target at ₹110, you risk ₹5 to make ₹10. That's a 1:2 risk-reward ratio, meaning the potential reward is twice the risk. Traders often express the same idea in units of R, where 1R is the amount risked. A trade that makes twice its risk is a +2R winner, and a stopped-out trade is a −1R loser.
Breakeven Win Rate: The Number Most Traders Skip
Your risk-reward ratio determines how often you need to win just to break even. The formula is:
Breakeven win rate = 1 ÷ (1 + reward-to-risk ratio)
- At 1:1 reward-to-risk, you must win 50% of the time to break even.
- At 1:2, you need only about 33%.
- At 1:3, only 25%.
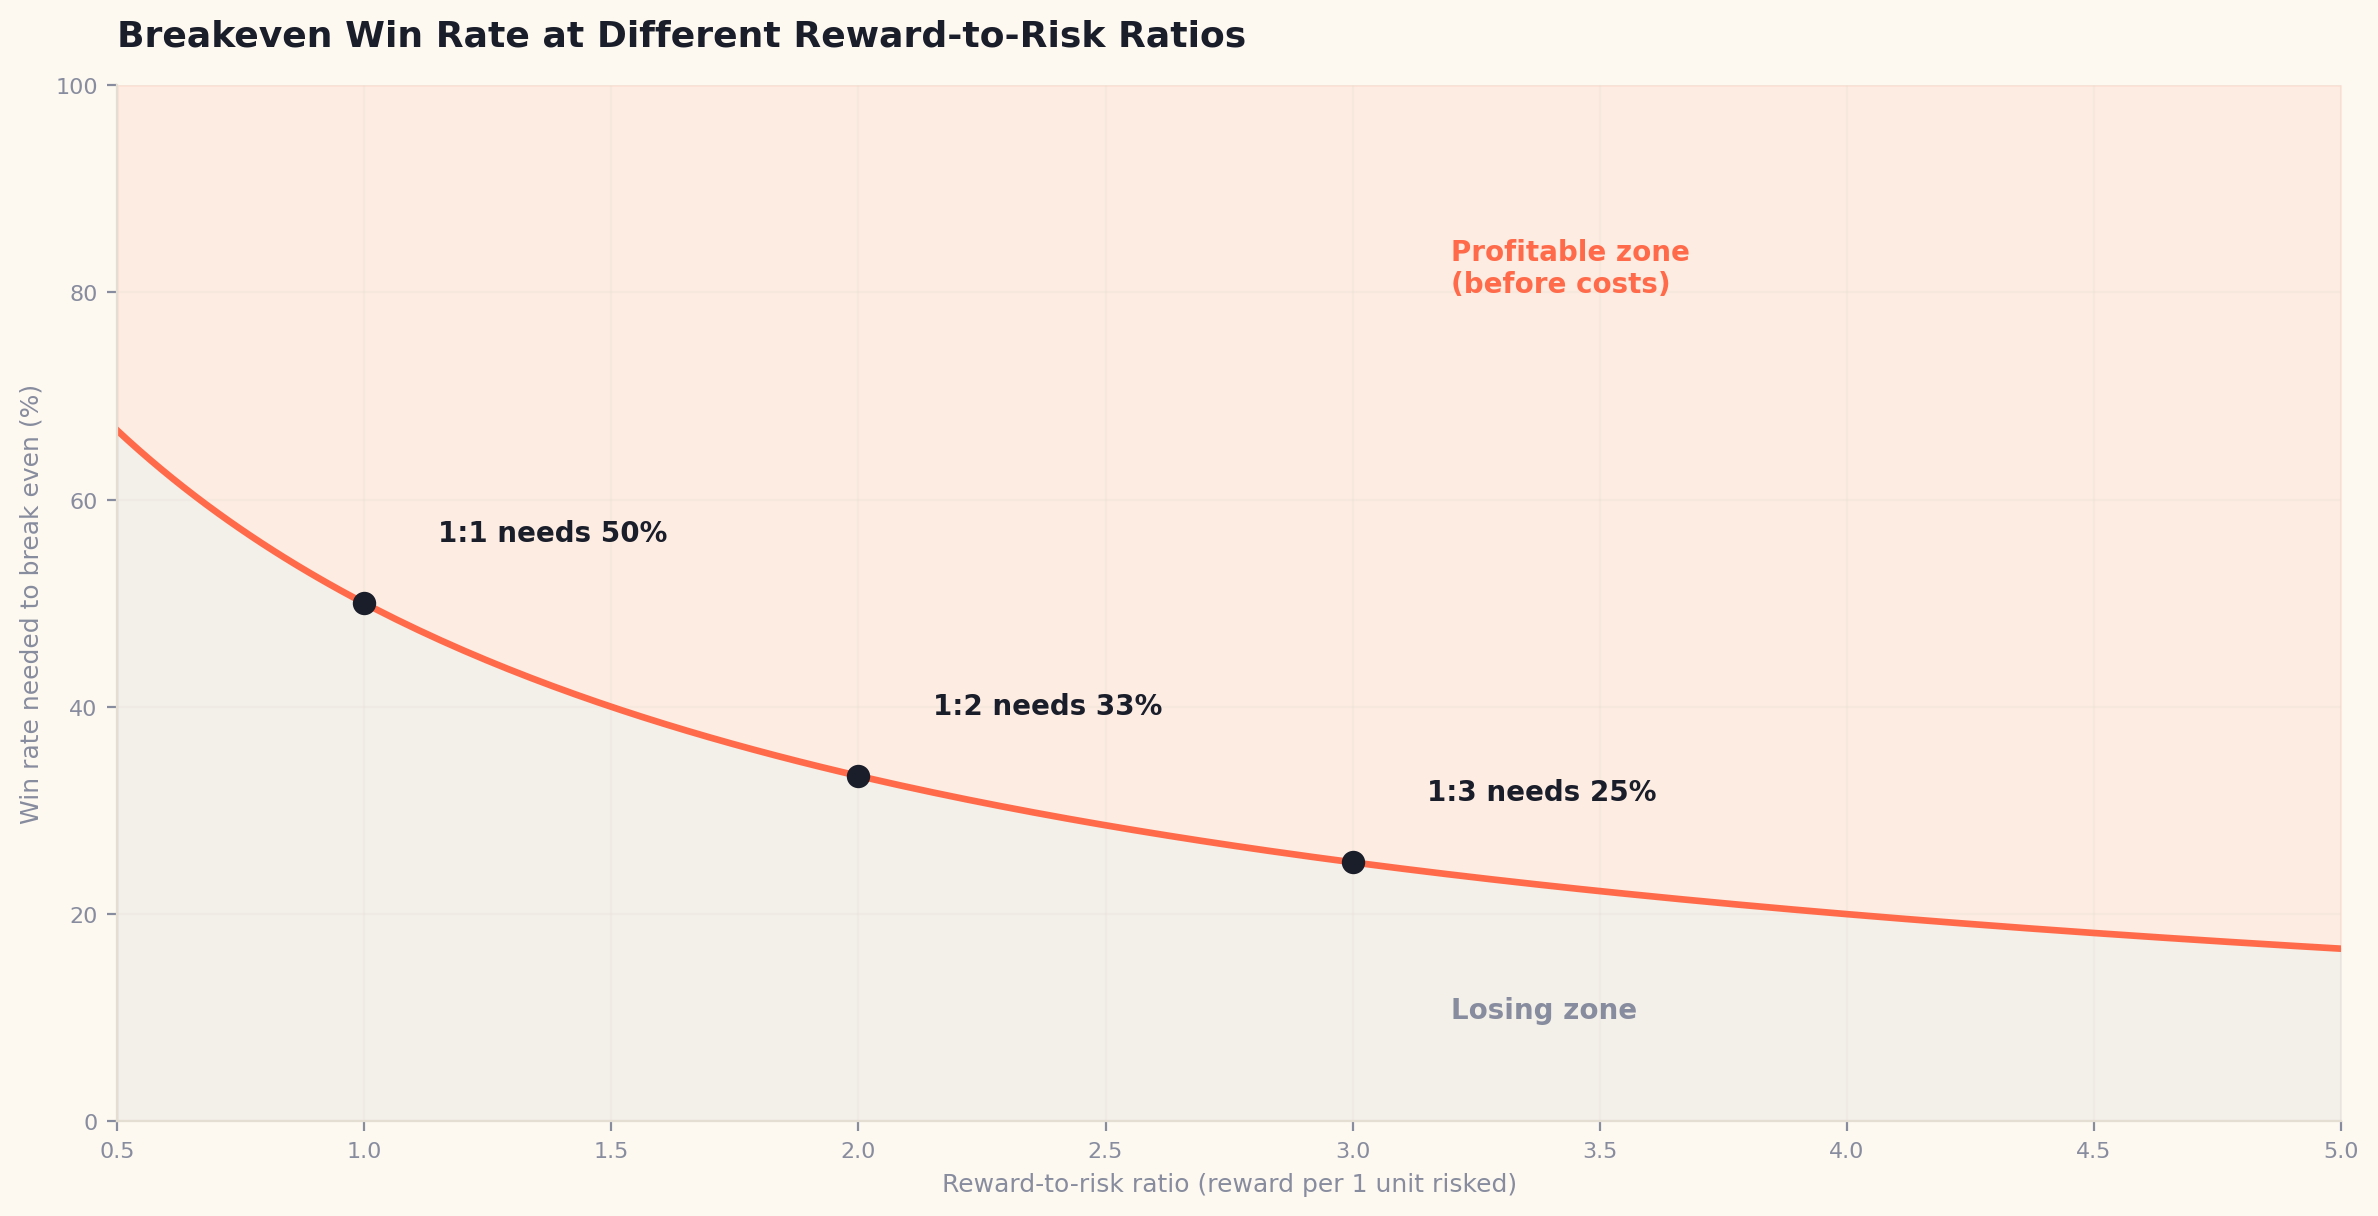
The higher your reward-to-risk ratio, the lower the win rate you need. This is pure math and ignores costs, which raise the bar slightly.
This is why a low win rate is not automatically a problem. It only becomes a problem when it's too low for the reward-to-risk ratio you're actually achieving.
What is Expectancy?
Expectancy is the average amount you expect to make (or lose) per trade over a large number of trades. It combines win rate and payoff size into one number:
Expectancy = (Win rate × average win) − (Loss rate × average loss)
Suppose a strategy wins 40% of the time, the average winner is +2R, and the average loser is −1R:
Expectancy = (0.40 × 2) − (0.60 × 1) = 0.80 − 0.60 = +0.2R per trade
Positive expectancy means that, over many trades, the strategy is expected to make money, even though most individual trades lose. Now compare a strategy that wins 70% of the time but has average winners of +0.5R and average losers of −2R:
Expectancy = (0.70 × 0.5) − (0.30 × 2) = 0.35 − 0.60 = −0.25R per trade
Despite winning seven times out of ten, it loses money. This is the trap behind strategies that take small profits quickly but let losers run.
Why Both Numbers Matter Together
Win rate and risk-reward are two sides of the same coin:
- High win rate, low reward-to-risk: feels great day to day, but one or two large losses can erase many small wins. Common in mean-reversion styles.
- Low win rate, high reward-to-risk: many small losses punctuated by occasional large wins. Common in trend-following styles, but psychologically hard because losing streaks are frequent.
Neither profile is better in itself. What matters is that the combination produces positive expectancy after costs, and that you can stay disciplined through the losing streaks the profile implies.
Costs Reduce Expectancy
Every trade carries costs: brokerage, taxes, exchange charges, and slippage. These come off every trade, winners and losers alike, so they reduce your expectancy directly. A strategy with a thin positive expectancy before costs can easily turn negative after them, especially if it trades often. Always evaluate expectancy net of realistic costs, which is one reason a proper backtest should include them.
Expectancy Is Not the Whole Story
A positive expectancy tells you the average trade is profitable. It doesn't tell you how rough the ride is. Two strategies can share the same expectancy but have very different drawdowns, and the one with deep drawdowns may be untradeable in practice. That's why expectancy should be read alongside risk-adjusted measures such as the Sharpe ratio.
Sample size matters too. Expectancy calculated from a handful of trades is mostly noise. You need enough trades for the average to mean something.
How to Improve Your Expectancy
- Cut losers at planned levels. Consistent stop-loss placement protects the average loss.
- Let winners run when the strategy supports it. A trailing stop can raise average win size.
- Filter out low-quality setups. Fewer, better trades can raise both win rate and payoff.
- Reduce costs. Trade liquid stocks and avoid unnecessary turnover.
- Validate honestly. Test on unseen data so the expectancy you measure isn't an overfitting artifact.
Frequently Asked Questions
What is a good risk-reward ratio? There's no single answer. Many systematic traders look for at least 1:1.5 to 1:2 in trend-style strategies, but a lower ratio can work if the win rate is high enough. What matters is that the combination gives positive expectancy after costs.
Is a 50% win rate good? It depends entirely on payoff size. At 1:1 reward-to-risk, 50% is exactly breakeven before costs. At 1:2 it would be quite profitable.
How is expectancy different from profit factor? Expectancy is the average result per trade. Profit factor is total gross profit divided by total gross loss. Both describe profitability, from slightly different angles.
How many trades do I need to trust an expectancy figure? More is better. A few dozen trades is a bare minimum, and small samples can be misleading because a couple of outsized trades can dominate the average.
See the Real Numbers for Your Strategy
Win rate, average win, average loss, and drawdown are all measurable. Backtest your strategy in MilesBT and see its real trade statistics before risking capital.
Validate this strategy yourself
Stop relying on rules of thumb. Test indicators and custom swing setups against 5+ years of verified Indian market data on MilesBT.
Open Backtest Builder