What is Drawdown in Trading? Why It Matters More Than Returns
Ask a trader how their strategy performed and they'll usually tell you the return. Ask them how it felt to trade it, and the honest answer is almost always about drawdown — the stretch where the account was down 20%, 30%, or worse, and every day felt like it might get worse before it got better. Return tells you what a strategy made. Drawdown tells you what you'd have to survive to get there.
What is Drawdown?
Drawdown is the decline in an account or strategy's value from its most recent peak to its lowest point before a new peak is reached. It's usually expressed as a percentage.
If your account grows from ₹10,00,000 to ₹12,00,000, then falls to ₹9,60,000 before recovering, your drawdown at the bottom was:
(₹12,00,000 − ₹9,60,000) / ₹12,00,000 = 20%
Every equity curve has drawdowns — even the best trading strategies and the best investors in history have spent extended periods below their prior peak. What separates a survivable strategy from a dangerous one isn't whether it has drawdowns, it's how deep they get and how long they last.
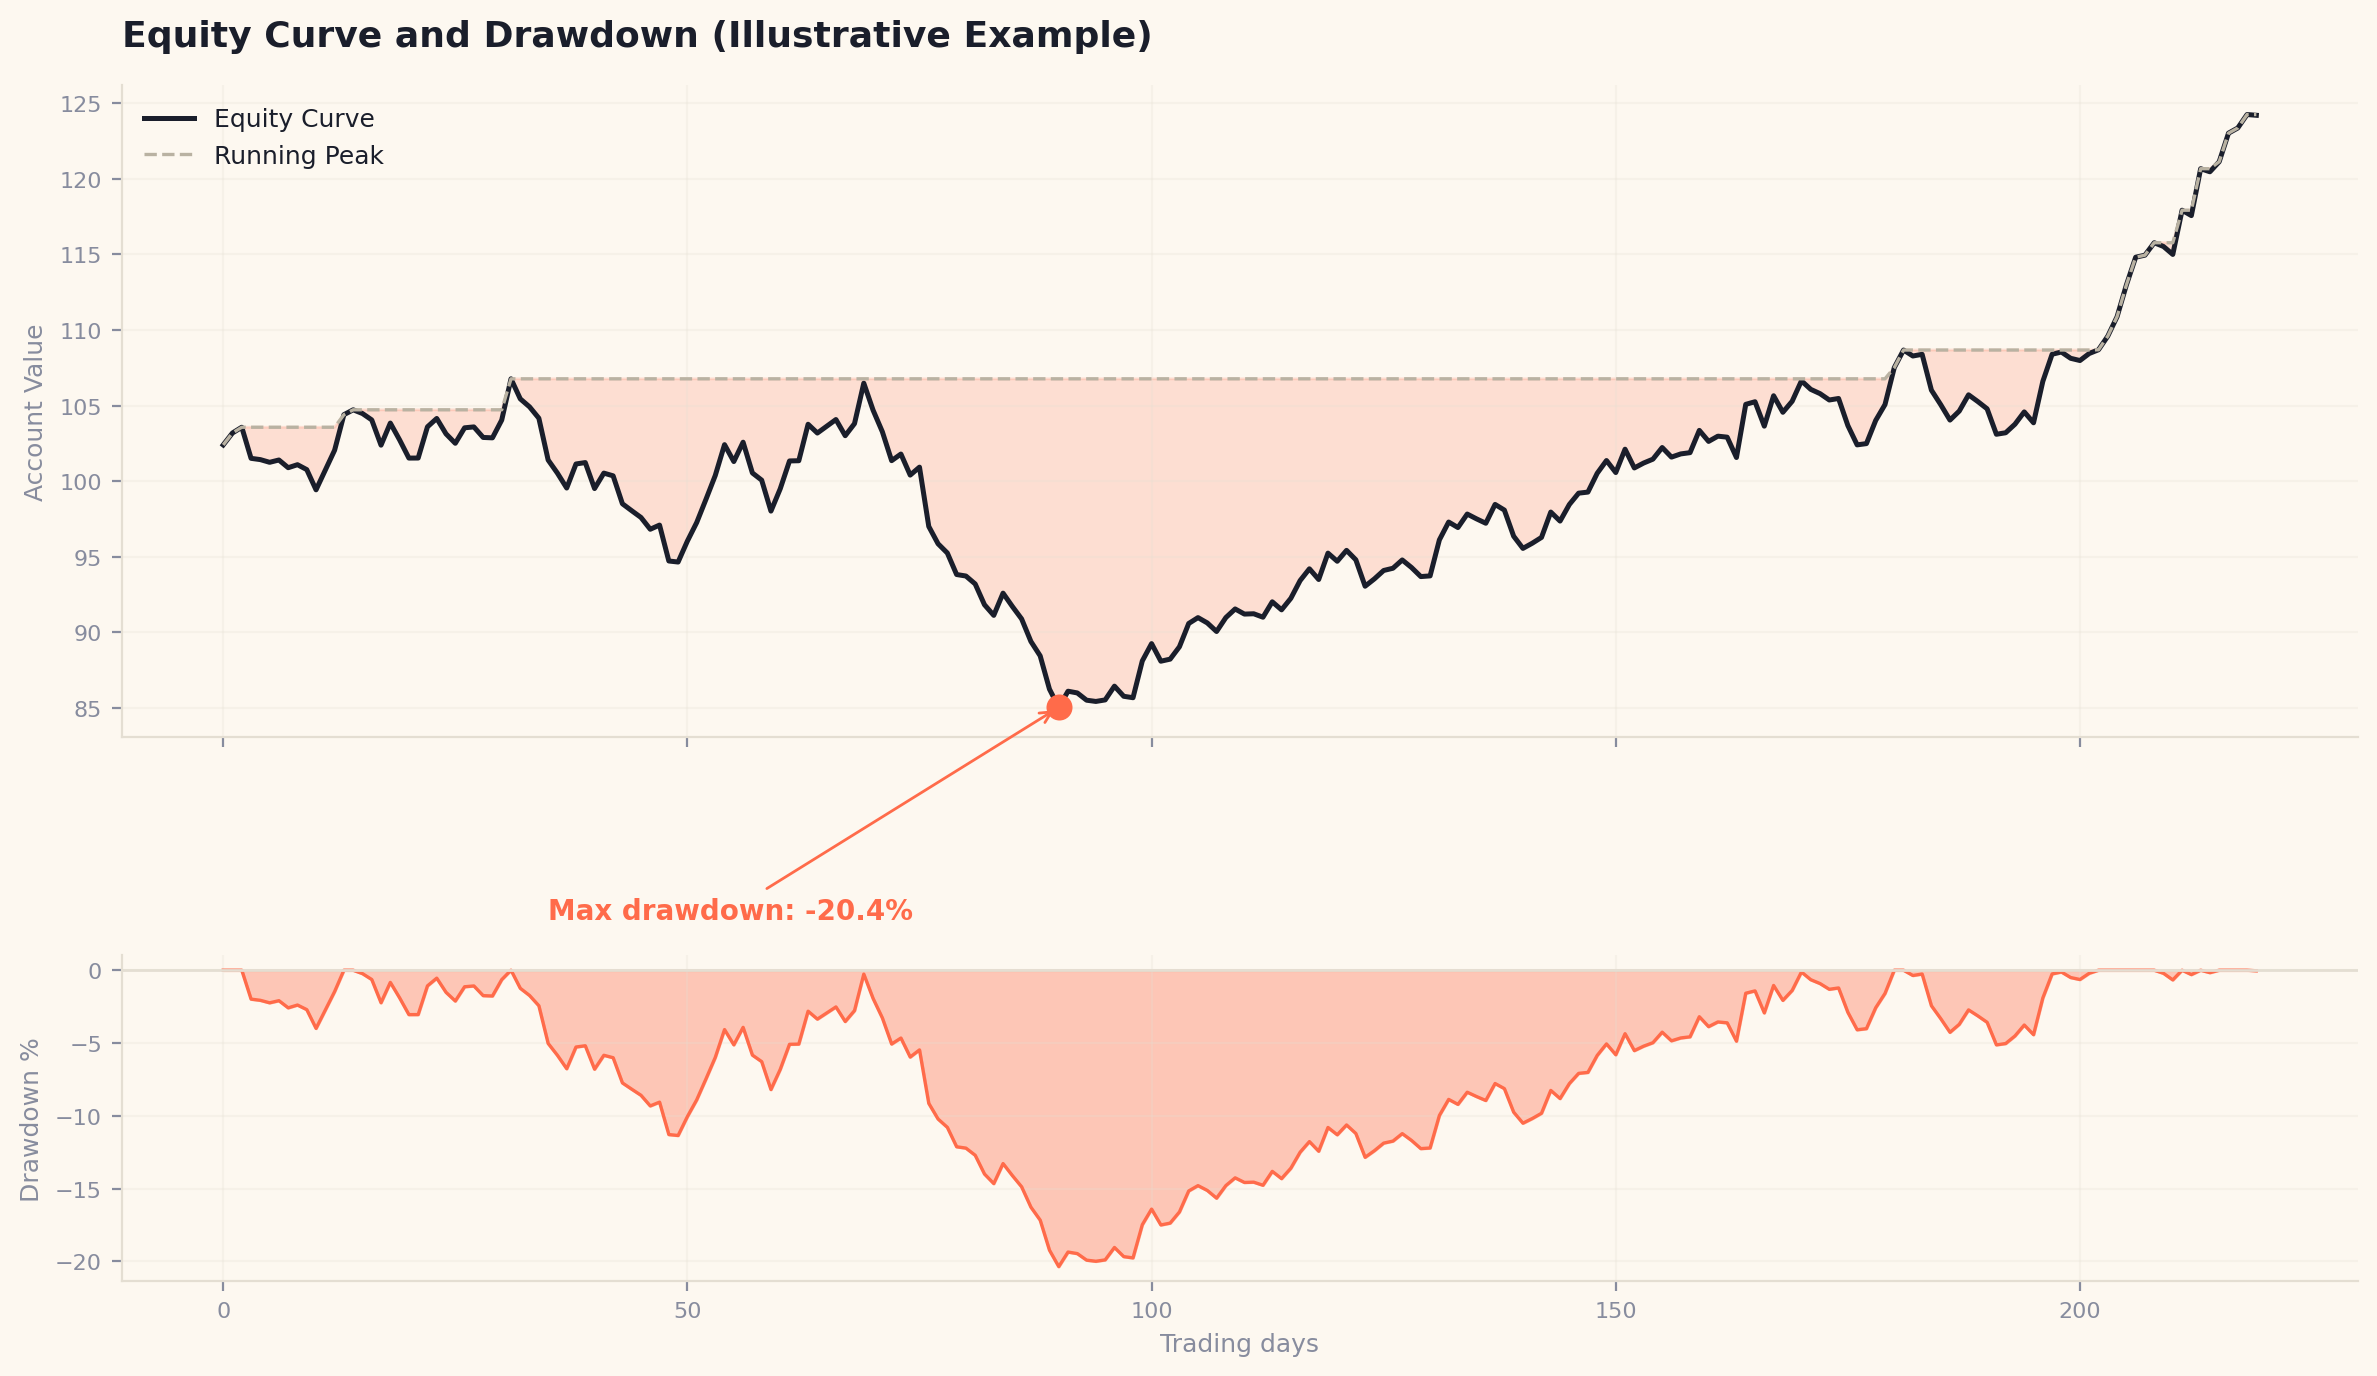
Illustrative example — an equity curve with its running peak and the resulting drawdown. Not real market data.
Max Drawdown vs. Current Drawdown
These two terms get used interchangeably, but they're not the same:
- Current drawdown is how far below the most recent peak the account sits right now.
- Max drawdown is the single worst peak-to-trough decline across the entire history being measured — the deepest hole the strategy has ever dug itself into.
When you see a backtest report, "max drawdown" is the number to look at first, before net return. It's the closest thing to an answer to the question: what's the worst this strategy has ever done to an account, and could I have stayed disciplined through that?
Why Drawdown Recovery Math Is Brutal
This is the part most new traders underestimate: losses and the gains needed to recover from them are not symmetric. The bigger the drawdown, the disproportionately larger the recovery required just to get back to even.
| Drawdown | Gain Required to Recover | |---|---| | 10% | 11.1% | | 20% | 25% | | 30% | 42.9% | | 50% | 100% | | 75% | 300% |
A 50% drawdown doesn't need a 50% gain to recover — it needs a 100% gain, because you're now compounding from a much smaller base. This is exactly why risk management and position sizing (covered in how to build a swing trading strategy) matter more than squeezing out a slightly higher win rate. Avoiding deep drawdowns in the first place is far more valuable than trying to trade your way back out of one.
Drawdown vs. Return: Why Both Matter Together
A strategy that returns 40% a year sounds better than one that returns 18% a year — until you learn the first one has a 60% max drawdown and the second has a 15% max drawdown. Most traders can't psychologically tolerate watching 60% of their capital disappear, even temporarily, and end up abandoning the strategy at exactly the wrong moment — locking in the loss instead of waiting for the recovery the backtest already priced in.
This is why metrics like the Sharpe ratio exist — they adjust return for the volatility (and by extension, the drawdown risk) it took to earn it, so you're comparing strategies on a like-for-like basis instead of chasing the highest headline number.
How to Calculate Drawdown in a Backtest
For any equity curve, max drawdown is calculated by:
- Tracking the running peak value of the account at every point in time
- At each point, calculating the percentage decline from that running peak to the current value
- Recording the largest such decline across the entire backtest period
Any proper backtesting tool should report this automatically — if a platform only shows you total return without a max drawdown figure, you're missing half the picture needed to judge whether a strategy is actually tradeable.
How to Reduce Drawdown
- Position sizing. Risking a fixed, small percentage of capital per trade (rather than a fixed share count) keeps any single losing streak from compounding into a catastrophic drawdown.
- Diversification across uncorrelated setups. A single strategy concentrated in one universe or one entry type will have deeper drawdowns than a portfolio of strategies that don't all lose money at the same time.
- Stop losses, consistently applied. A strategy is only as good as its worst undefended trade — skipping a stop loss "just this once" is how a normal drawdown turns into an account-ending one.
- Out-of-sample validation. A strategy that was curve-fit to historical data often shows an artificially shallow backtested drawdown that doesn't hold up once it's trading on data it wasn't tuned against.
Frequently Asked Questions
What is considered an acceptable max drawdown? There's no universal number — it depends on your risk tolerance and time horizon. As a general reference point, many systematic strategies target a max drawdown in the 15–25% range as something a disciplined trader can realistically hold through without abandoning the strategy; drawdowns beyond that become progressively harder to sit through psychologically, even when the strategy is statistically sound.
Is drawdown the same as a loss? Not exactly. A loss is realized when a position is closed at a lower value than it was entered at. Drawdown measures the decline of the overall account or strategy equity curve from its peak, which can include unrealized losses on open positions as well as the cumulative effect of multiple closed trades.
Why do backtests sometimes understate real-world drawdown? Backtests that ignore slippage, transaction costs, or that were curve-fit to a specific historical period tend to show a shallower drawdown than what actually occurs in live trading, where execution isn't perfect and market conditions inevitably shift outside the tested window.
See a Strategy's Real Drawdown Before You Trade It
A backtest without a clear max drawdown number isn't giving you the full picture. Run your strategy in MilesBT and see the actual equity curve, drawdown periods, and recovery time — not just the headline return.
Validate this strategy yourself
Stop relying on rules of thumb. Test indicators and custom swing setups against 5+ years of verified Indian market data on MilesBT.
Open Backtest Builder