RSI Indicator Explained: Formula, Settings, and Why 70/30 Misleads
The Relative Strength Index (RSI) is probably the most widely used momentum indicator in retail trading. Almost everyone learns the same rule: buy when RSI drops below 30, sell when it rises above 70. Almost nobody is told that this rule, applied blindly, can keep you selling a strong trend all the way up. Here's what RSI actually measures, how to read it properly, and where it misleads.
What is the RSI Indicator?
RSI is a momentum oscillator developed by J. Welles Wilder that measures the speed and size of recent price changes on a scale from 0 to 100. It answers a simple question: over the last N periods, have gains or losses been larger?
The standard setting is 14 periods. The calculation works like this:
- Compute the average gain and the average loss over the lookback period (Wilder's smoothing is used after the first window).
- Divide them: RS = Average Gain ÷ Average Loss
- Convert to the index: RSI = 100 − (100 ÷ (1 + RS))
When recent gains dominate, RSI rises toward 100. When recent losses dominate, it falls toward 0. A reading near 50 means gains and losses are roughly balanced.
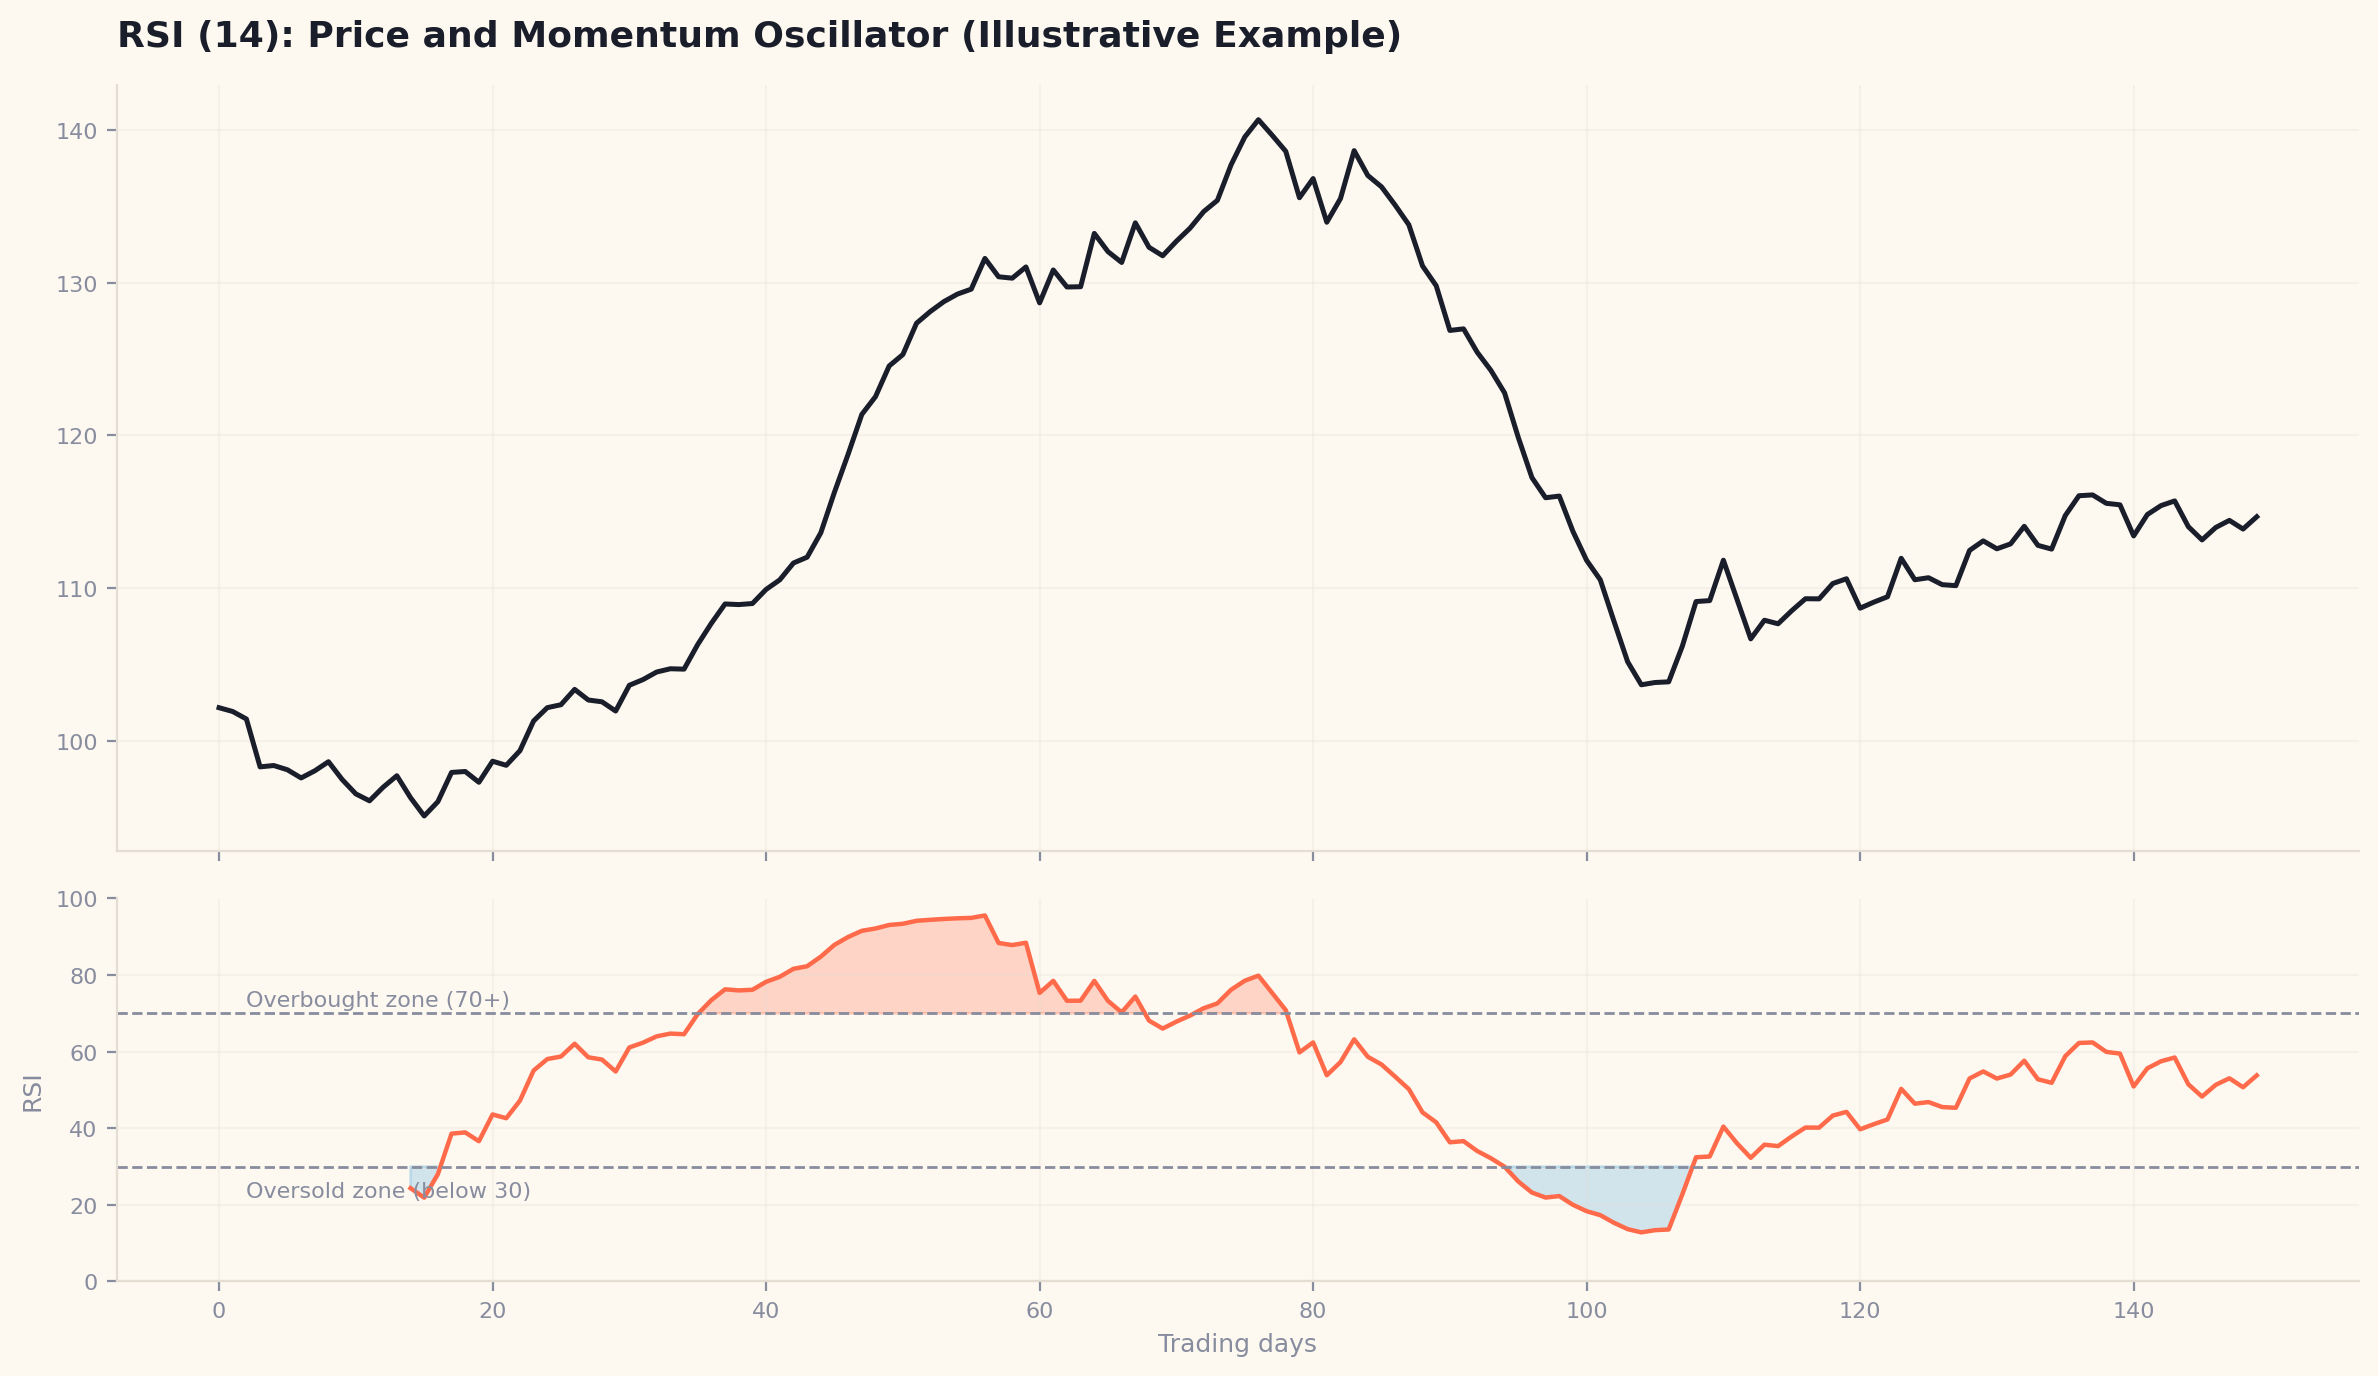
Illustrative example: price (top) and 14-period RSI (bottom). Notice RSI stays in overbought territory for a long stretch during the strong rise. Not real market data.
The 70 and 30 Levels
By convention, an RSI above 70 is called "overbought" and below 30 "oversold." The idea is that a stretched reading may precede a pullback or bounce.
The problem is the labels. "Overbought" does not mean "about to fall." In a strong uptrend, RSI can stay above 70 for weeks while price keeps climbing, as the chart above shows. A trader who shorts every 70 reading in that environment gets run over. The same applies in reverse in a downtrend, where RSI can sit below 30 while price keeps sliding.
RSI Behaves Differently in Trends and Ranges
This is the single most useful thing to understand about RSI:
- In a range-bound market, RSI's extremes often do line up with turning points, so 70/30 style mean-reversion signals tend to work better.
- In a strong trend, RSI tends to hold a higher band in uptrends and a lower band in downtrends. Many traders treat readings that hold above roughly 40 to 50 during pullbacks as a sign the uptrend is intact, rather than as sell signals. These bands are commonly cited rules of thumb, not fixed laws.
So the first question isn't "is RSI above 70?" It's "is this market trending or ranging?" Pairing RSI with a simple trend filter, such as price relative to a long moving average, changes how you interpret it.
Three Ways Traders Use RSI
1. Overbought and Oversold Reversals
The classic use. Best suited to range-bound conditions and to instruments that mean-revert. Risky as a standalone signal in trends.
2. Pullback Entries Within a Trend
In an uptrend, wait for RSI to dip toward a lower level, then turn back up, and enter with the trend. This uses RSI to time entries rather than to call tops.
3. Divergence
When price makes a new high but RSI makes a lower high, momentum is fading even as price rises. The reverse applies at lows. Divergence is a warning, not a trigger, and it can persist for a long time before price reacts.
Should You Change the RSI Settings?
The default 14 is a reasonable starting point, not a rule. Shorter periods make RSI more sensitive, with more signals and more noise. Longer periods smooth it, with fewer but slower signals. The right choice depends on your holding period and your universe, and the honest way to decide is to backtest alternatives instead of copying a number from a video. Be careful about overfitting: a setting that looks perfect on past data may just be tuned to noise.
Common RSI Mistakes
- Treating 70 as an automatic sell and 30 as an automatic buy. These are context-dependent zones, not signals.
- Ignoring the trend. The same reading means different things in a trend and in a range.
- Using RSI alone. It says nothing about volume, trend strength, or risk. Combine it with other rules and proper stop-loss placement.
- Optimizing the period until the backtest looks great. That is curve fitting.
RSI and MACD: Different Tools
RSI measures the pace of recent price changes and is bounded between 0 and 100. MACD measures the relationship between two moving averages and is unbounded. They capture different aspects of momentum, which is why some traders use one to confirm the other.
Frequently Asked Questions
What is a good RSI setting for swing trading? The default of 14 is the common starting point. Whether a shorter or longer period suits your strategy is best decided by testing on your own universe.
Is RSI a leading or lagging indicator? It's derived from past prices, so it is fundamentally lagging, though divergences can sometimes flag momentum shifts earlier than price does.
Does RSI above 70 mean I should sell? Not necessarily. In strong uptrends RSI can remain above 70 for extended periods. Treat it as a sign of strong momentum first, and confirm with trend and structure before acting.
Can RSI be used alone? It can generate signals, but relying on it alone usually leads to poor results in trending markets. Pair it with a trend filter and validate the combination with a backtest.
Test RSI Rules on Real Nifty Data
Whether an RSI rule has an edge depends on your universe, settings, and market regime. Build and backtest an RSI strategy in MilesBT and see how it holds up across years of real market history.
Validate this strategy yourself
Stop relying on rules of thumb. Test indicators and custom swing setups against 5+ years of verified Indian market data on MilesBT.
Open Backtest Builder