Swing Trading Pullback Strategy: A Complete Rule Set You Can Backtest
Most swing trading advice stops at "buy the dip in an uptrend." That's an idea, not a strategy. You can't test an idea, and you can't trade it consistently, because "the dip" means something different every time you look at a chart.
This post gives you the whole thing: a complete pullback strategy for the Nifty 50 with exact entry conditions, exit conditions, and position sizing. Every rule is measurable, so you can run it through a no-code backtester and see how it would have performed before you risk any money.
One important note before we start: these are starting-point rules, not a proven money machine. The numbers below are reasonable defaults, not optimized values. Whether the strategy has an edge is exactly what the backtest is for.
The Idea: Buy the Reclaim, Not the Dip
In an uptrend, stocks rarely rise in a straight line. They climb, slip back below a short-term average, then push higher again. The moment price moves back above that average after dipping below it is a simple, objective signal that the dip may be over.
That is the whole strategy in one sentence: in a confirmed uptrend, buy when price closes back above the 20-day EMA after having dipped below it.
Notice what this avoids. You are not guessing where a dip will end, and you are not buying while price is still falling. You wait for the reclaim, which costs a little in price but filters out many dips that keep going.
The Complete Rule Set
Universe: Nifty 50 stocks, daily timeframe.
Entry: all four conditions true on the same day
- Close is above the 200-day EMA. The long-term trend is up.
- 20-day EMA is above the 50-day EMA. The medium-term trend is up.
- Close crosses above the 20-day EMA. Price was below it and has reclaimed it. This is the pullback signal.
- RSI(14) is above 40. This avoids buying dips that are still accelerating downward.
Exit: whichever happens first
- Trend break: close falls below the 50-day EMA
- Stop loss: 5% below entry
- Profit target: 10% above entry
Position sizing
- Risk 1% of capital per trade. With a 5% stop, that means each position is about 20% of capital.
- Hold at most 5 positions at once.
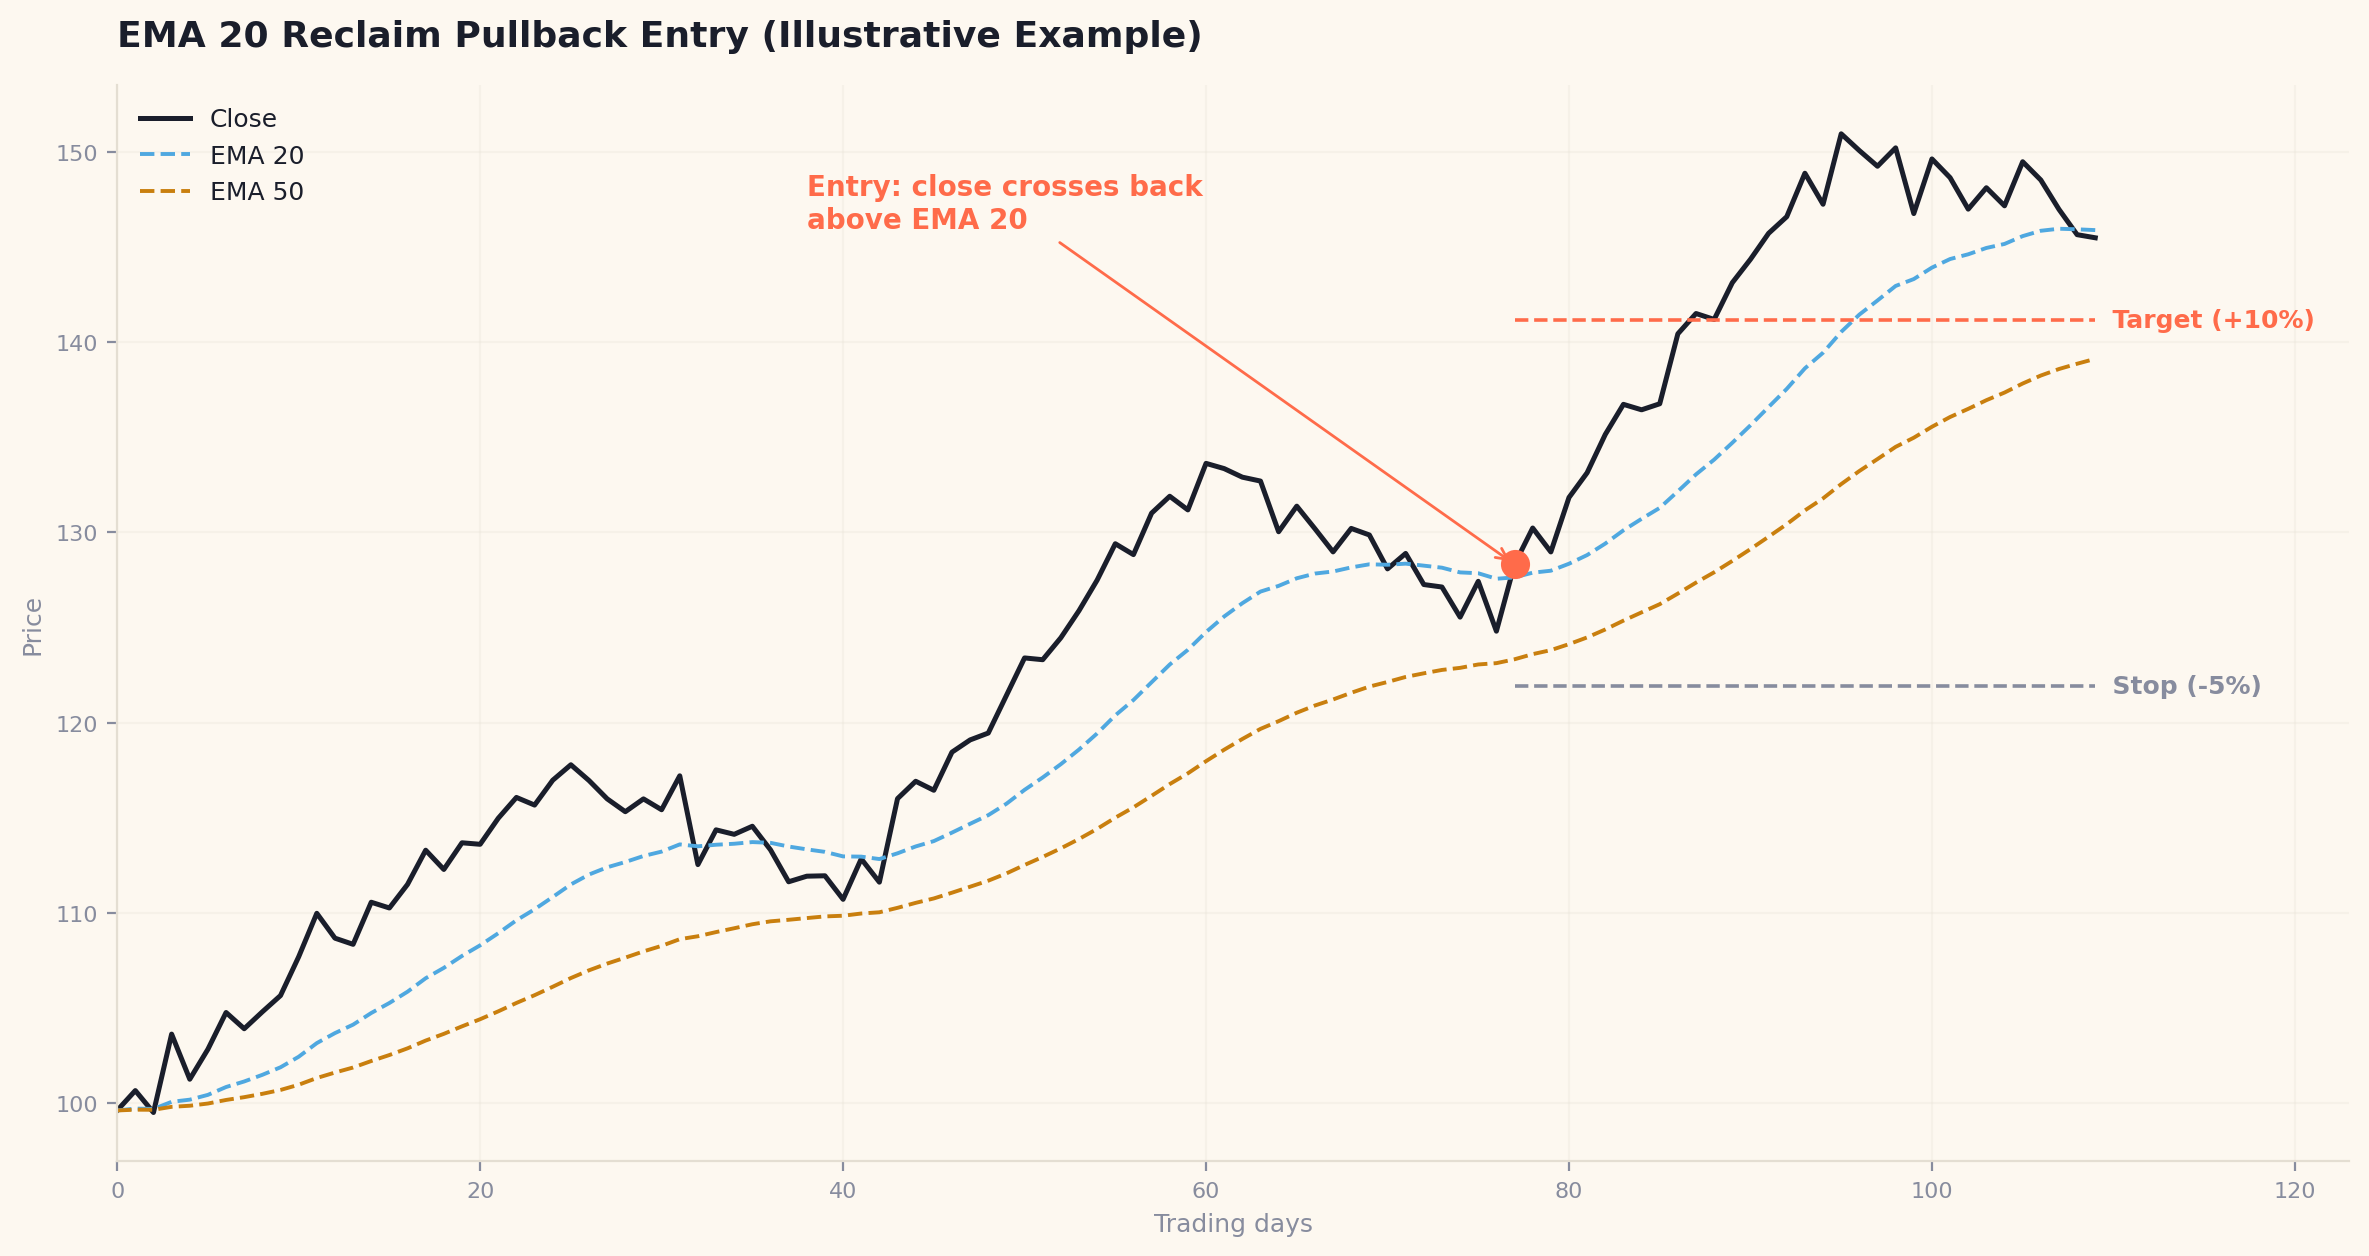
Illustrative example of the entry: price dips under the 20-day EMA, then closes back above it. The 200-day EMA filter isn't shown. Not real market data.
Why Each Rule Is There
The 200-day EMA filter keeps you out of stocks in long-term downtrends. Buying dips in a downtrend is one of the fastest ways to lose money, because the "dip" is often just the trend continuing.
The 20 over 50 EMA filter confirms the medium-term trend is also up. The pullback then happens inside an uptrend on two timeframes, not just one.
The EMA 20 cross is the trigger. Because a cross requires price to have been below the average first, it captures "dip, then resume" in a single condition. No subjective judgment about what counts as a dip.
The RSI filter is a light sanity check. If RSI is very low when price reclaims the EMA, the stock was probably falling hard and the reclaim may be a brief bounce. See how RSI behaves in trends for more on reading it in context.
The exits cover three different ways a trade can end. The trend-break exit gets you out when the uptrend fails. The 5% stop caps the loss. The 10% target gives a 2:1 reward-to-risk ratio, which means you don't need to win most of the time to make money. The risk-reward and expectancy guide shows the math.
What This Strategy Does Not Do
Being clear about the limits is part of trading it honestly:
- It uses fixed percentages for stops and targets, which ignore how volatile each stock is. A 5% stop is roomy for a calm large-cap and tight for a jumpy one. That's a deliberate simplification you can improve later, and it's also covered in the stop-loss methods guide.
- It will miss strong stocks that never pull back. You'll sit in cash while they run.
- It can be whipsawed in choppy markets, where price keeps crossing the EMA without trending.
- It says nothing about market-wide conditions. Sharp market-wide selloffs can hit many positions at once.
How to Backtest It
Enter the rules exactly as written. Don't change anything on the first run.
- Run the defaults first. Resist tuning until you've seen the baseline.
- Include realistic costs. Brokerage, taxes, exchange charges, and slippage all reduce results, and a strategy with a thin edge can turn negative once they're included.
- Read the whole result, not just total return. Check the number of trades, max drawdown, profit factor, win rate, and average win versus average loss. A result built on very few trades is closer to luck than an edge.
- Look at different market phases. See how it did in trending years, choppy years, and sharp corrections separately.
- Change one thing at a time. Try EMA 10 instead of 20, a stop of 4% or 6%, or an RSI threshold of 45 or 50. If small changes cause wild swings in results, the edge is fragile.
- Validate on unseen data. Build and tune on an older stretch of history, then run the unchanged rules on a recent stretch. This is the core idea behind in-sample vs out-of-sample testing.
The full process, including how to avoid the common traps, is in the guide to backtesting without coding.
Ways to Improve It Later
Once you have a baseline you understand, these are natural next experiments, each tested one at a time:
- Volatility-based stops using ATR instead of a fixed percentage
- A trailing stop in place of the fixed 10% target, to let big winners run
- A volume filter so the reclaim happens on stronger participation
- A market-wide filter, such as only trading when the Nifty index itself is above its 200-day average
Add one at a time, and keep a change only if it holds up on data you didn't tune it on. Each extra rule you add raises the risk of overfitting.
Frequently Asked Questions
Is this a proven profitable strategy? No. It's a clear, testable starting rule set. Whether it makes money depends on the period, the stocks, and costs, which is why you backtest it rather than assume.
Why use the 20-day EMA for the pullback? It's a common short-term reference that price tends to oscillate around in trends. It's a default, not a magic number. Test alternatives like the 10 or 30-day EMA.
Why require RSI above 40? It's a simple filter to avoid buying while the dip is still accelerating. The exact threshold is a parameter to test, not a rule.
Can I use this on stocks outside the Nifty 50? You can, but liquidity matters. Less liquid stocks mean more slippage, which can wipe out a modest edge. Test the universe you actually plan to trade.
How many trades do I need to trust the result? More is better. A few dozen trades is a bare minimum, and small samples can be dominated by a couple of unusual trades.
Run This Strategy Yourself
Everything above is measurable, which means you can test it in minutes. Build this exact rule set in MilesBT's no-code backtester, run it on the Nifty 50, and check the drawdown, win rate, and full trade log before deciding whether it deserves real capital.
Validate this strategy yourself
Stop relying on rules of thumb. Test indicators and custom swing setups against 5+ years of verified Indian market data on MilesBT.
Open Backtest Builder